Mockup / Illustrative
Descriptive Statistics - Housing Data
Preview of Dataset
Available at https://raw.githubusercontent.com/ageron/handson-ml2/master/datasets/housing/housing.tgz
Preview of First 10 Rows
Full dataset has 20640 rows, 20640 columns
| longitude | latitude | housing_median_age | total_rooms | total_bedrooms | population | households | median_income | median_house_value | ocean_proximity | |
|---|---|---|---|---|---|---|---|---|---|---|
| 0 | -122.23 | 37.88 | 41.0 | 880.0 | 129.0 | 322.0 | 126.0 | 8.3252 | 452600.0 | NEAR BAY |
| 1 | -122.22 | 37.86 | 21.0 | 7099.0 | 1106.0 | 2401.0 | 1138.0 | 8.3014 | 358500.0 | NEAR BAY |
| 2 | -122.24 | 37.85 | 52.0 | 1467.0 | 190.0 | 496.0 | 177.0 | 7.2574 | 352100.0 | NEAR BAY |
| 3 | -122.25 | 37.85 | 52.0 | 1274.0 | 235.0 | 558.0 | 219.0 | 5.6431 | 341300.0 | NEAR BAY |
| 4 | -122.25 | 37.85 | 52.0 | 1627.0 | 280.0 | 565.0 | 259.0 | 3.8462 | 342200.0 | NEAR BAY |
| 5 | -122.25 | 37.85 | 52.0 | 919.0 | 213.0 | 413.0 | 193.0 | 4.0368 | 269700.0 | NEAR BAY |
| 6 | -122.25 | 37.84 | 52.0 | 2535.0 | 489.0 | 1094.0 | 514.0 | 3.6591 | 299200.0 | NEAR BAY |
| 7 | -122.25 | 37.84 | 52.0 | 3104.0 | 687.0 | 1157.0 | 647.0 | 3.1200 | 241400.0 | NEAR BAY |
| 8 | -122.26 | 37.84 | 42.0 | 2555.0 | 665.0 | 1206.0 | 595.0 | 2.0804 | 226700.0 | NEAR BAY |
| 9 | -122.25 | 37.84 | 52.0 | 3549.0 | 707.0 | 1551.0 | 714.0 | 3.6912 | 261100.0 | NEAR BAY |
| longitude | latitude | housing_median_age | total_rooms | total_bedrooms | population | households | median_income | median_house_value | |
|---|---|---|---|---|---|---|---|---|---|
| count | 20640.000000 | 20640.000000 | 20640.000000 | 20640.000000 | 20433.000000 | 20640.000000 | 20640.000000 | 20640.000000 | 20640.000000 |
| mean | -119.569704 | 35.631861 | 28.639486 | 2635.763081 | 537.870553 | 1425.476744 | 499.539680 | 3.870671 | 206855.816909 |
| std | 2.003532 | 2.135952 | 12.585558 | 2181.615252 | 421.385070 | 1132.462122 | 382.329753 | 1.899822 | 115395.615874 |
| min | -124.350000 | 32.540000 | 1.000000 | 2.000000 | 1.000000 | 3.000000 | 1.000000 | 0.499900 | 14999.000000 |
| 25% | -121.800000 | 33.930000 | 18.000000 | 1447.750000 | 296.000000 | 787.000000 | 280.000000 | 2.563400 | 119600.000000 |
| 50% | -118.490000 | 34.260000 | 29.000000 | 2127.000000 | 435.000000 | 1166.000000 | 409.000000 | 3.534800 | 179700.000000 |
| 75% | -118.010000 | 37.710000 | 37.000000 | 3148.000000 | 647.000000 | 1725.000000 | 605.000000 | 4.743250 | 264725.000000 |
| max | -114.310000 | 41.950000 | 52.000000 | 39320.000000 | 6445.000000 | 35682.000000 | 6082.000000 | 15.000100 | 500001.000000 |
<1H OCEAN     9136
INLAND        6551
NEAR OCEAN    2658
NEAR BAY      2290
ISLAND           5
Name: ocean_proximity, dtype: int64


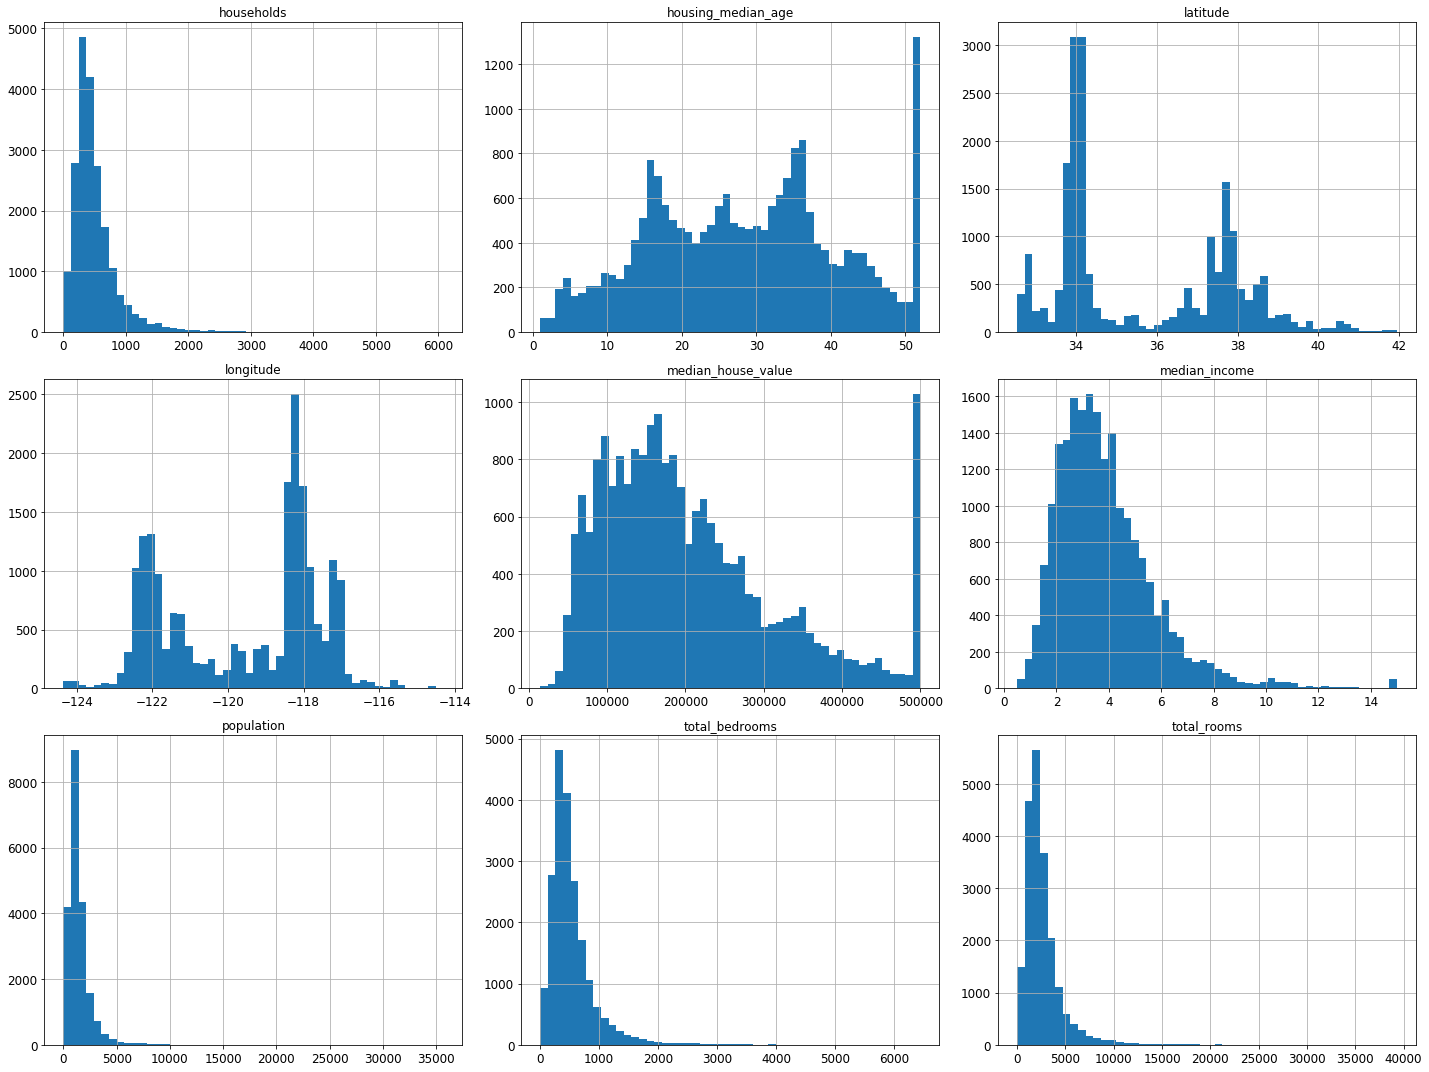
Saving figure attribute_histogram_plots
The implementation of test_set_check() above works fine in both Python 2 and Python 3. In earlier releases, the following implementation was proposed, which supported any hash function, but was much slower and did not support Python 2:
If you want an implementation that supports any hash function and is compatible with both Python 2 and Python 3, here is one:
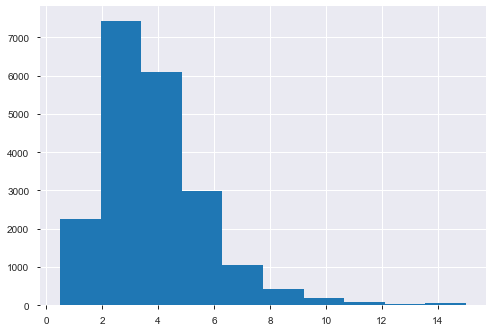
Median Income
<matplotlib.axes._subplots.AxesSubplot at 0x133e082b0>
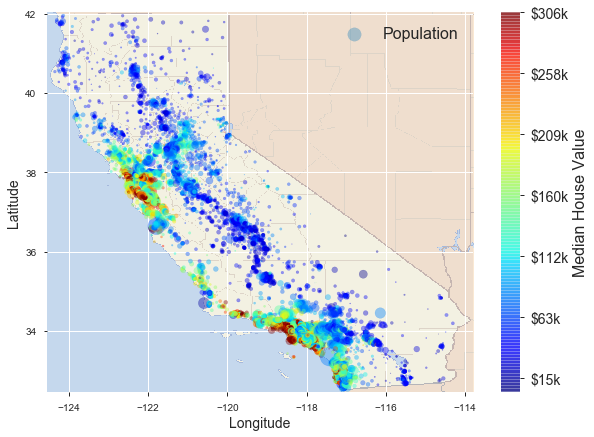
Geographic Distribution
Correlation with median_house_value
median_house_value    1.000000
median_income         0.687160
total_rooms           0.135097
housing_median_age    0.114110
households            0.064506
total_bedrooms        0.047689
population           -0.026920
longitude            -0.047432
latitude             -0.142724
Name: median_house_value, dtype: float64
Scatterplot Matrix
Saving figure scatter_matrix_plot
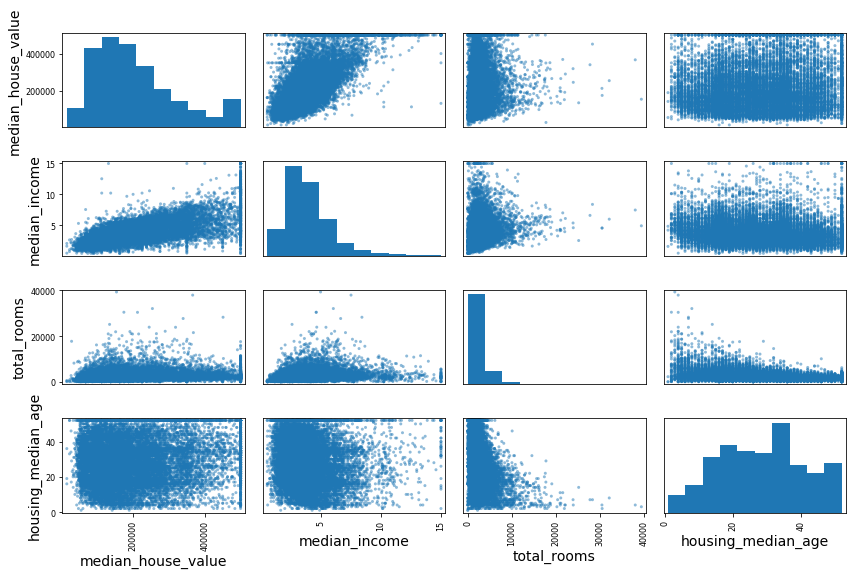
Median House Value vs. Median Income
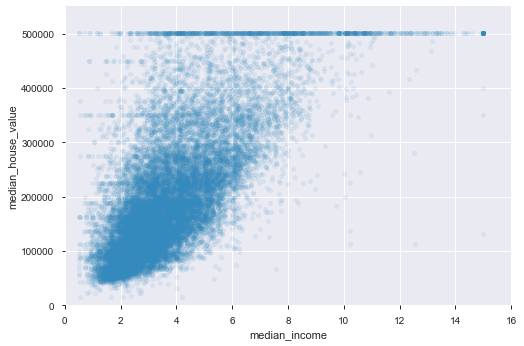
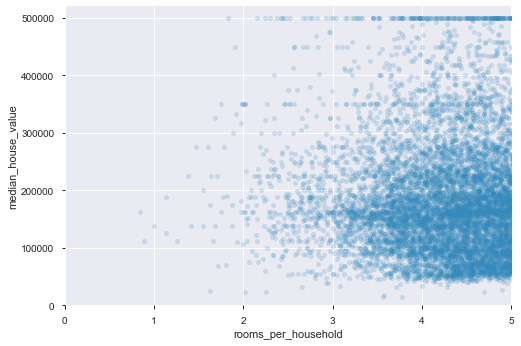
Scatterplot Rooms Per Household vs. Median House Value
